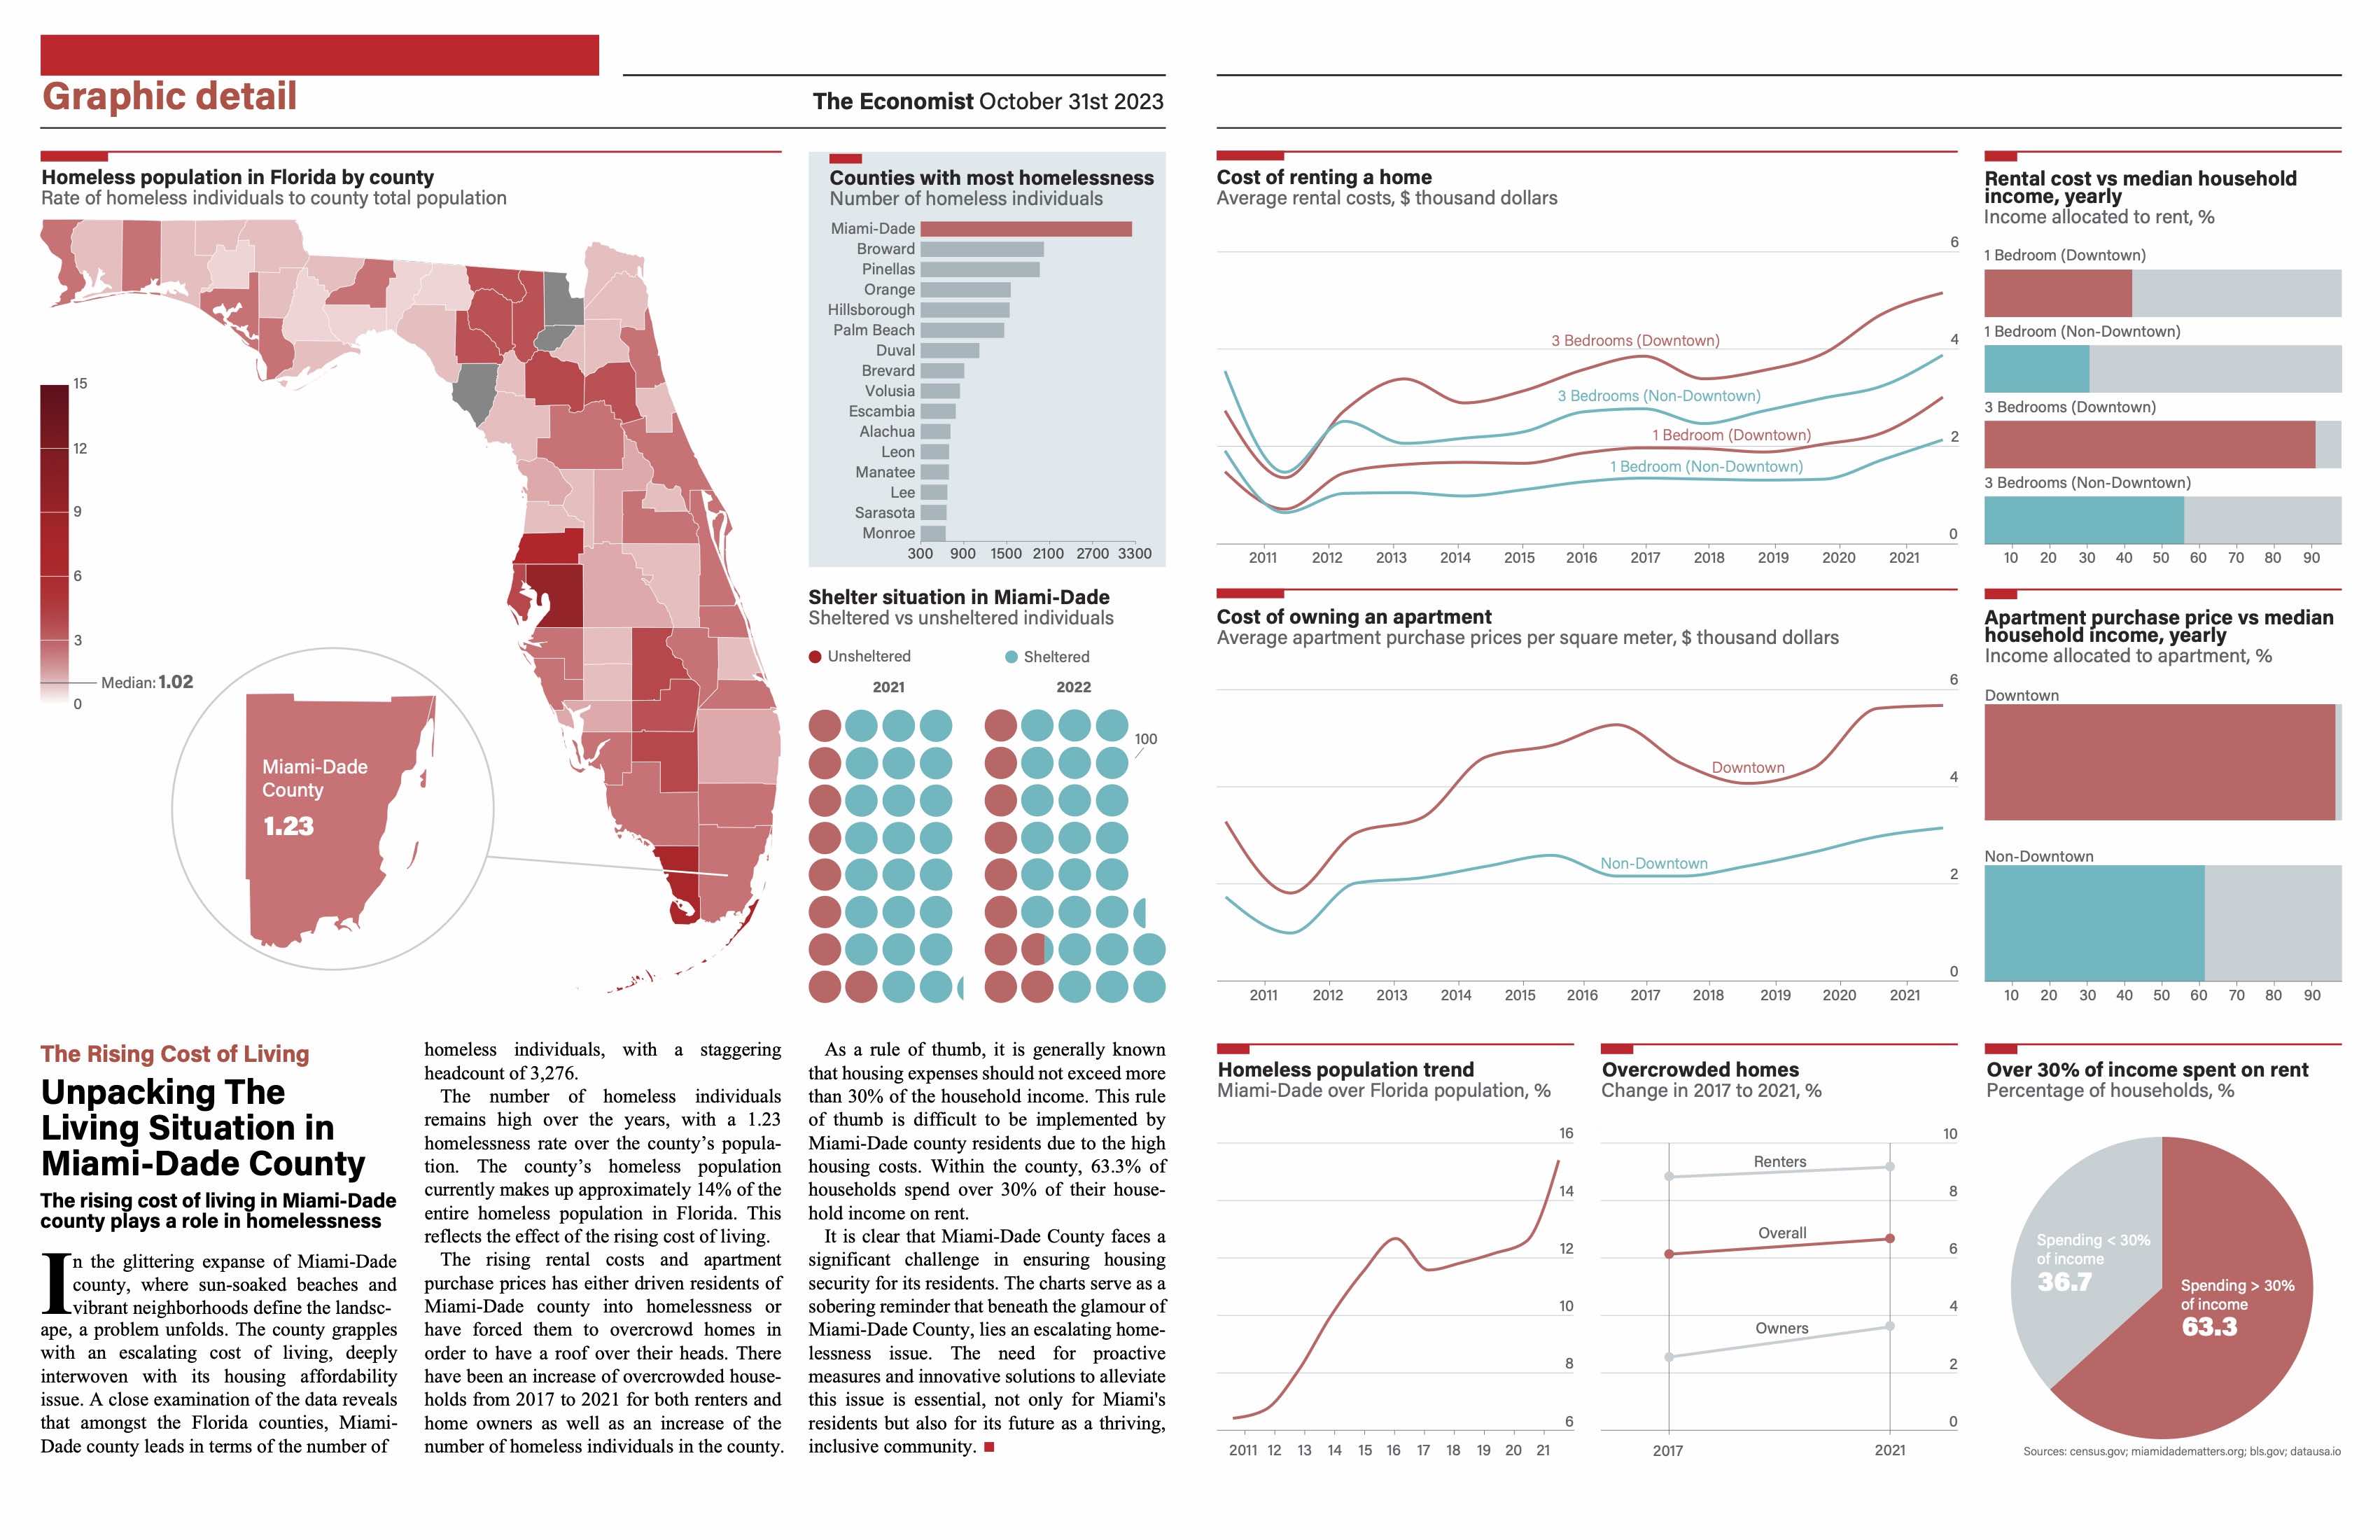
Data Visualization & Strategy

Transform your raw data into clear, compelling visuals that tell a story. I create interactive dashboards, reports, or custom visualizations (static or interactive, print or web) that make complex information understandable and engaging for your audience.
What’s Included:
✔️ 1:1 intake call to understand your goals and audience
✔️ Custom dashboard/report design (using Tableau, Power BI, or Looker Studio) OR bespoke visualizations (D3.js, Observable, Flourish)
✔️ Clear narrative framing with annotations and context
✔️ Exported files and/or live dashboard link
✔️ One round of revisions
Sample work: https://tjanmichela.com/navigating-indonesias-earthquakes/
Best for: Those who want to make data-driven decisions and communicate them effectively.
The work is tailored to your specific needs, so the project’s size will determine the time and resources required to get it done right. The price displayed is my hourly rate.
