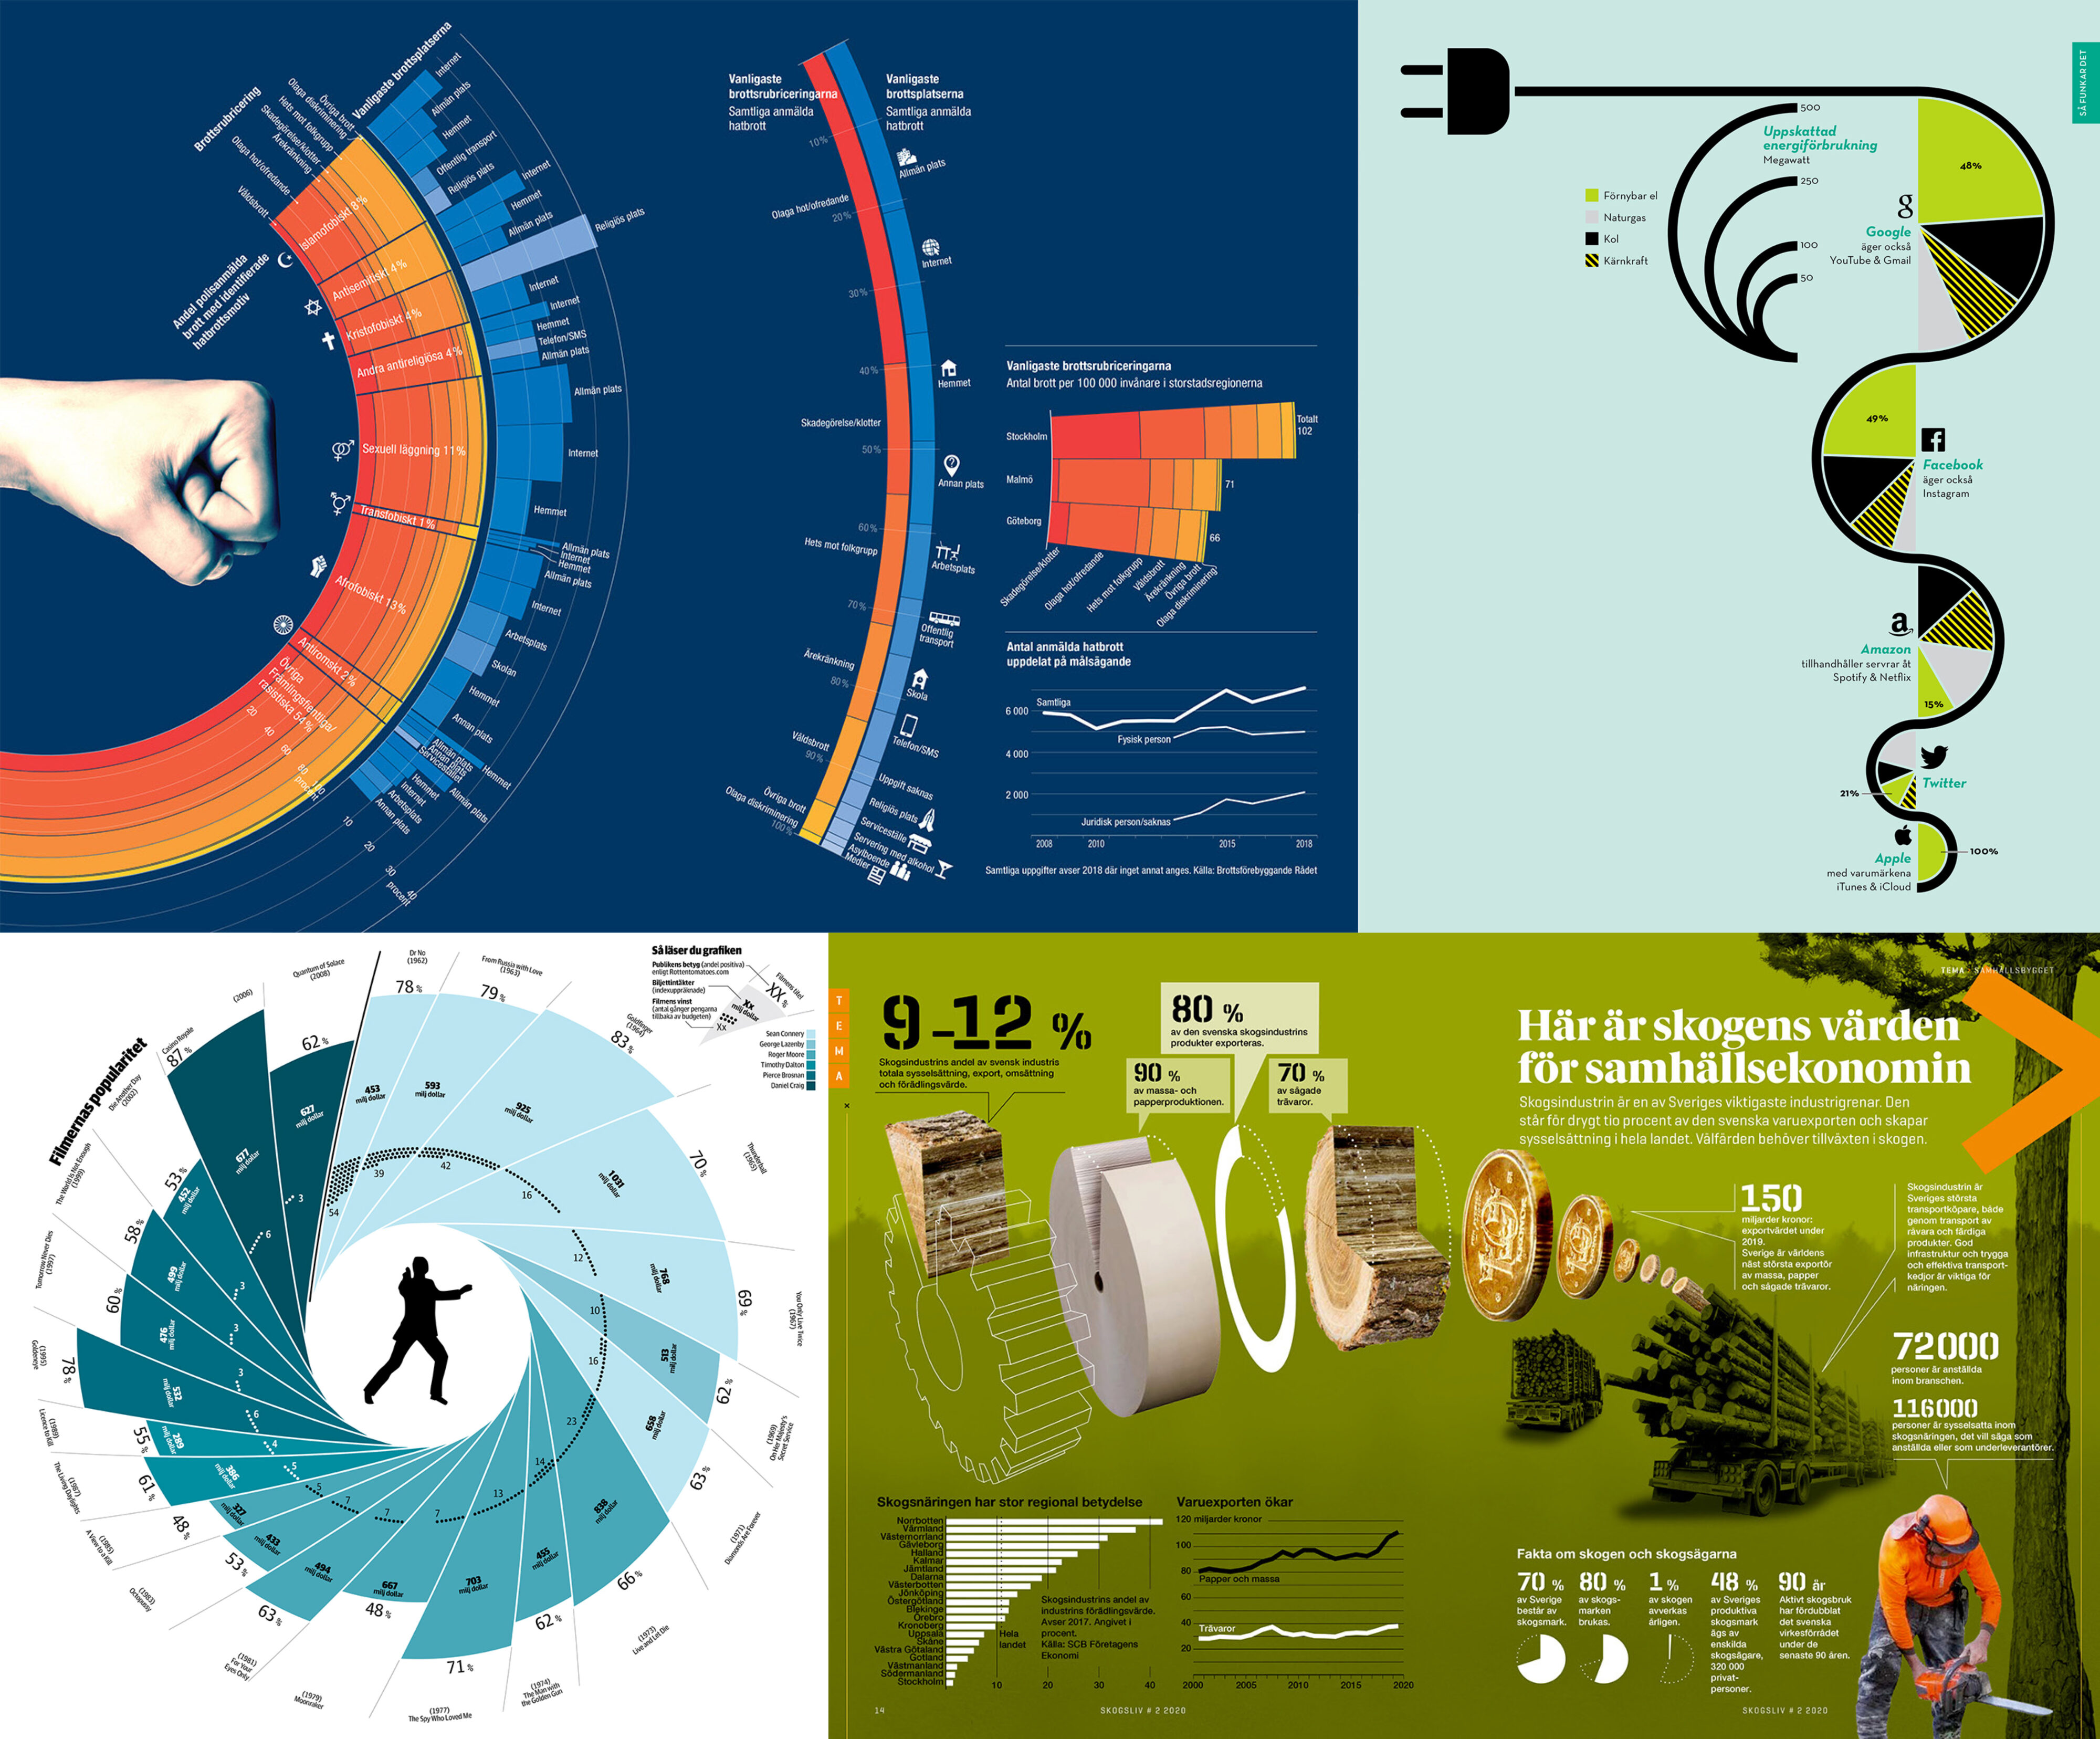
Data Freelancer Profile

Erik Nylund
Portfolio https://www.eriknylund.se/
LinkedIn Profile https://www.linkedin.com/in/erik-nylund-5b5a5060/
Secondary Specialties Data Visualization & Storytelling
Core Languages JavaScript
Data Analytics Skills Excel, GIS & Mapping, Google Sheets, QGIS, Spreadsheet Tools
Data Graphics & Design Skills Adobe Illustrator, Design Tools
Industry Experience Healthcare & Life Sciences, Financial Services & Banking, Technology & Software, Manufacturing & Supply Chain, Government & Public Sector, Education & Research, Energy & Utilities, Non-profit & NGOs
Education
Journalism, 1999–2001, Ljungskile folkhögskola, Sweden

